 This software was developed at, with copyright held by, The Smith-Kettlewell Eye Research Institute in San Francisco by Manfred MacKeben, Ph.D., with significant contributions and encouragement from August Colenbrander, MD, and programming by Alexander Gofen. Financial support was received from Prevent Blindness Northern California, The Pacific Vision Foundation, and a grant from the National Institute on Disability and Rehabilitation Research (NIDRR).
PURPOSE
What visual capacity has someone left to face the tasks of independent living?
The MMT assesses remaining vision in people with macular and/or foveal vision loss, with the particular goal to find intact areas of the retina that can be used for eccentric viewing. If run at low contrast, the MMT is sensitive to subtle changes in retinal function, even if they are not evident yet.
RATIONALE
There is a need for a simple topographic test of macular vision that does not require:
- expensive equipment
- special expertise
- much time
Topographic testing of remaining vision is important, because it assesses the function of retinal regions outside the fovea, where signs of trouble may appear first.
IMPLEMENTATION
The test consists of custom software that runs on IBM PC-compatible computers under any version of Windows (including Vista and Windows 7) and requires no hardware modifications.
SETUP
The person to be tested sits in front of a monitor, and the chin can be stabilized by a chin rest. The person is asked to direct his/her gaze at what is perceived to be the center of a specially designed background pattern that looks like an eight-spoke wagon wheel. This improves gaze stability, which is questionable in people with foveal vision loss. This pattern provides peripheral landmarks that can signal when the eye has moved.
PROCEDURE
Thirty-three positions in the central visual field are tested by the brief appearance of a target (letter, Landolt C, or Snellen E). The 32 test positions are located in the center (the fovea) and on 4 evenly spaced rings of 8 positions each, where the outermost lies 8 degrees away from the fovea. Letter sizes increase linearly with the eccentricity of the tested position, and the base value can be adjusted to 10 levels.
Each target appears in an unpredictable location for typically 250 ms. Verbal report indicates whether or not a letter was seen, and if yes, which letter it was. The examiner types in the response, the computer scores each response and creates a record in a data base. The basic test of 36 trials takes only 3 minutes to complete.
MORE TEST OPTIONS
- Promising areas can be examined with 9 closely spaced additional targets to increase spatial resolution of the test.
- In order to allow even more detailed analysis, any region of the screen can be examined in fine detail using a mouse-driven mode.
- The user can switch from single targets to 5-letter words.
- The luminance contrast between targets and background can be set at 16 different levels.
- Contrast polarity can be reversed (i.e. to light on dark).
- Results can be shown as summary charts in two formats, or as table that includes all single-trial information. All three forms of output can be printed.
- All data are stored in a data base that is managed by the program.
RESULTS
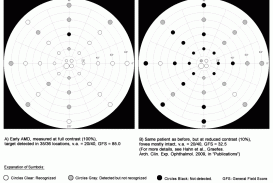
The responses are scored in the following way:
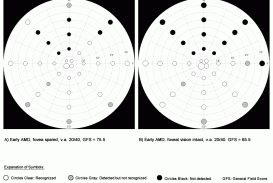
- Target seen and correctly recognized – 2 points, clear white
- Target seen, but not recognized – 1 point, gray or half black
- Target not seen at all – 0 point, black
The test data can be presented and inspected in three different formats:
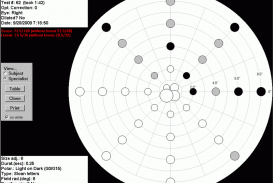
- Each test position is shown as circle, where the diameter indicated the size of the target presented in the test (expert view).
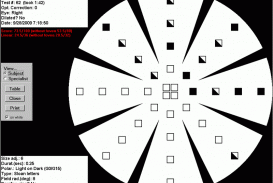
- Test positions are shown as bold squares of standard size to make understanding the results easier for the tested person (patient view).
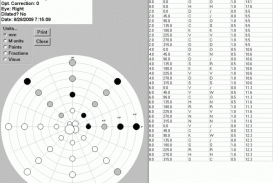
- As a numerical list of all individual trials with the trial #, position, target shown, target size, response, score (data table).
All three results sheets can be printed. Below, the same data set is shown in all three formats.
In addition, the results can be summarily expressed as a “general field score” (a single number) by adding all single-trial scores. This can happen linearly, or weighted by eccentricity in the visual field. These calculations are performed automatically at the end of each trial run (see red print in the upper left of the full-scale result formats above).
Examples:
DEMO
You can download a limited demo version of the Macular Mapping Test here:
 MMT_demo.exe (448kB)
To download, click on “MMT_demo.zip” and save the file to disk, unzip the file, go to the folder MMT_demo, run MappingDemo.exe.
PURCHASE
If you want to buy the Macular Mapping Test, this is what you need to know:
Price: $ 500.00 (US Dollars)
Payment: in advance
Payment mode: By bank check (US or international), money order, or by direct money transfer to the MMTest bank account.
Bank: You will receive specifics upon receipt of your order.
To order, go to the contact page.
Upon reception of the payment, the software will be sent to you as an attachment to an email message, including supplementary material, like the manual.
The installation of the program is easy and automatic. It requires no special knowledge or skill.
Please note that the MMT is also available in German. To purchase that version, please contact: SEHSYSTEM / Dr. Werner Eisenbarth (email: eisenbarth.werner@t-online.de)
Publications about the Macular Mapping Test
Hahn GA, Messias A, Mackeben M, Dietz K, Horwath K, Hyvärinen L, Leinonen M, Trauzettel-Klosinski S. (2009) Parafoveal letter recognition at reduced contrast in normal aging and in patients with risk factors for AMD. Graefes Arch Clin Exp Ophthalmol. 247(1):43-51 [PDF]
MacKeben M. (2008) Topographic mapping of residual vision by computer. J. Visual Impairment & Blindness (Special Issue on AMD), October, Vol. 102, No.10, 649-6 [PDF]
Trauzettel-Klosinski S, Biermann P, Hahn G, Weismann M. (2003) Assessment of parafoveal function in maculopathy: a comparison between the Macular Mapping Test and kinetic Manual Perimetry. Graefes Arch Clin Exp Ophthalmol. 241(12):988-95 [PDF]
MacKeben,M. & Colenbrander, A. (2000) Topographic measurements of low contrast letter recognition as a tool for diagnosis and vision rehabilitation. Vision Rehabilitation (C.Stuen et al., eds), Swets & Zeitlinger, Lisse, pp. 158-160
MacKeben M., Colenbrander, A. & Gofen, A. (1999) Use your PC to quickly map remaining vision after foveal vision loss. Perimetry Update 1998/1999 (M.Wall & J.M.Wild, eds.), pp.307-316, Kugler Publications, The Hague [PDF]
MacKeben, M., Colenbrander, A.. and Schainholz,D. (1994) Comparison of Three Ways to Assess Residual Vision after Macular Vision Loss. In: “Low Vision – Research and New Developments in Rehabilitation”, Kooijman AC et al. (Eds.), IOS Press, Amsterdam, pp. 51-58 [PDF]
MacKeben, M. and Colenbrander, A. (1994) Mapping the topography of residual vision after macular vision loss. In: “Low Vision – Research and New Developments in Rehabilitation”, Kooijman AC et al. (Eds.), IOS Press, Amsterdam, pp. 59-67 [PDF]
In German:
Eisenbarth W & MacKeben M. (2008) Macular Mapping – AMD Screening für Augenoptiker. Deutsche Optiker Zeitung 6:32-37 [PDF]
